Size: x-small
Type: color
Klimaundersøkelsen 2023 – rapport
Om årets undersøkelse 2023
Dette er sjuende gang Klimaundersøkelsen gjennomføres. For første gang på fire år var det denne gang gått et helt år uten at Oslo eller nabokommunene hadde hatt noen form for koronarestriksjoner. Befolkning og næringsliv har likevel ikke vært upåvirket av andre, globale kriser det siste året. For noen av resultatene i årets undersøkelse kan det ha spilt inn, mens vi på andre spørsmål ser en stabil tendens over flere år.
Klimavennlig adferd er blitt vanlig
Folk flest reiser kollektivt i hverdagen, kutter matsvinn og velger elbil – hvis de i det hele tatt vil eie egen bil. De svarer også at de vil kutte i både forbruk, energibruk og konsumet av kjøtt. Støtten til at vi sammen skal kutte utslipp her hjemme er fortsatt stabilt høy. Etter 2020 ser vi en liten nedgang i støtten til felles klimatiltak, men fra et høyt nivå. Mest delt er befolkningen i synet på tiltak som påvirker biltrafikk og bilhold. I årets klimaundersøkelse er det også tegn på et fallende klimaengasjement hos de yngste.
Samtidig tyder ikke undersøkelsen på at endret holdning påvirker adferd i disse spørsmålene. Folk rapporterer at de oftere velger eller kommer til å velge klimavennlig transport i hverdagen. Både for sykling, gange og kollektivtrafikk ser vi en økning fra nivået før koronapandemien. Reisemønsteret er imidlertid ikke helt som før. Flere rapporterer for eksempel at de oftere jobber fra hjemmekontor enn før koronaen, noe som generelt fører til færre hverdagsreiser.
Hos næringslivet viser Klimaundersøkelsen en økende bevissthet rundt klimaledelse. Flere bedrifter fører klimaregnskap, har satt klimamål, stiller klima- og miljøkrav til sine leverandører og ser kommersielle muligheter i en grønnere økonomi. De store bedrifter ligger fortsatt et godt stykke foran de mindre bedriftene.
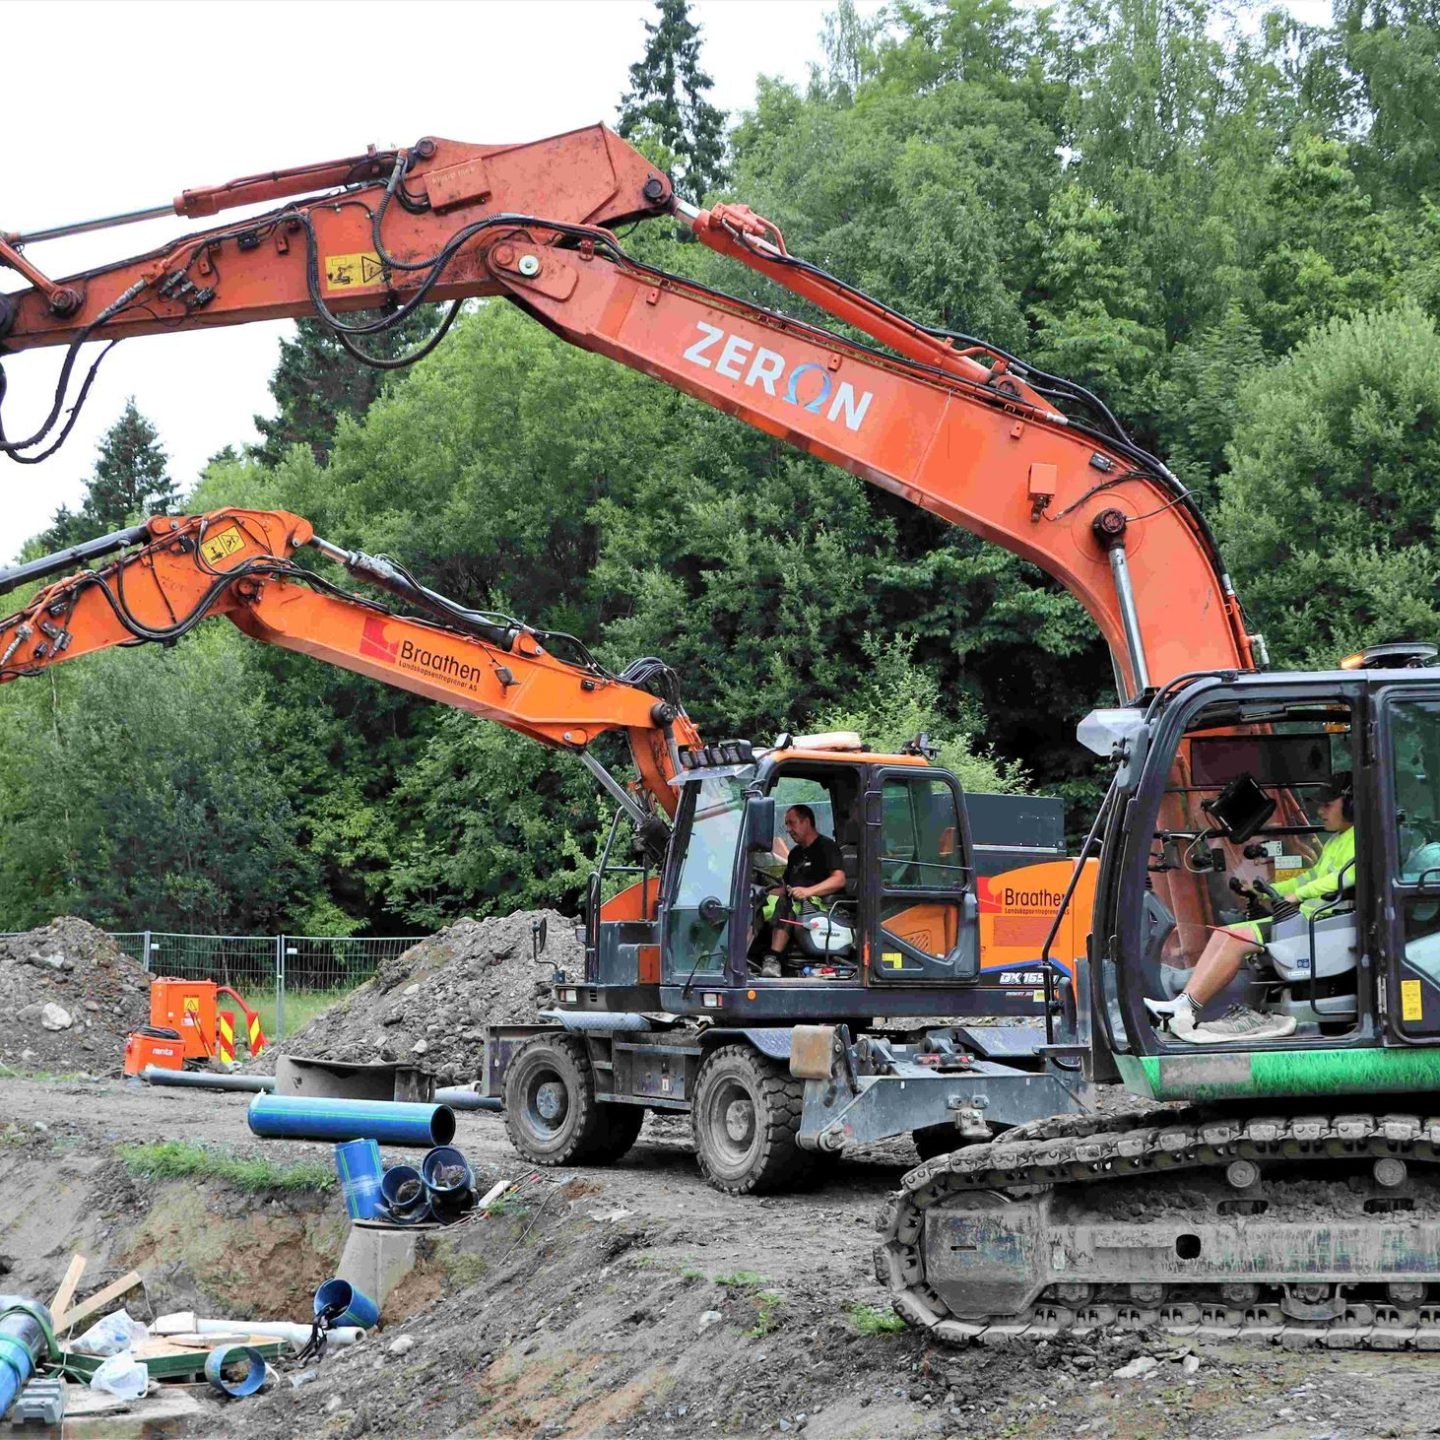
I år ser vi en nedgang i andelen bedrifter som er positive til mobilitetstiltak som treffer varetransporten. De er likevel mer positive til dette enn i 2021. Svarene tyder også på at høyere renter, dyrere energi og inflasjon påvirker prioriteringene. Om lag 1 av 5 bedrifter har nedprioritert klimatiltak p.g.a. økte kostnader, mens ca. 16 % har utsatt eller stanset overgangen til elektriske kjøretøy av samme grunn. Noen av bedriftene har også fremskyndet klimatiltak, men færre enn de som har nedprioritert.
Også bedriftene rapporterer at noen koronatiltak har blitt varige: Mange har fortsatt å erstatte reising med digitale møter, videreført fleksibel arbeidstid og holder åpent for delvis hjemmekontor.
Hva er Klimaundersøkelsen?
Bystyret i Oslo har vedtatt at Oslo skal bli en klimarobust by tilnærmet uten utslipp av klimagasser i 2030. Hvordan vi skal oppnå dette vises i kommunens klimastrategi. Den består av fem overordnede klimamål og 16 satsingsområder. Klimavennlig byplanlegging og -utvikling, infrastruktur og smarte energiløsninger vil spille en viktig rolle i veien fremover. Men for at Oslo skal nå sine klimamål, må også befolkningen og næringslivet være med på laget og ta del i store og små endringer.
Klimaundersøkelsen gjennomføres for å kartlegge både gjennomførte klimatiltak og potensialet for adferdsendringer som bidrar til å senke klimagassutslipp. Den avdekker i tillegg holdninger til klimamålene og Oslos klimaarbeid. Vi spør næringslivet og befolkningen i Oslo, men også befolkningen i nabokommunene i det tidligere Akershus. Deres aktiviteter i Oslo, ikke minst gjennom arbeidslivet, har mye å si for klimamålene.
Det er intervjuet 1503 innbyggere i Oslo og 1002 i Viken (gamle Akershus) i alderen 15 år og eldre. Årets utvalg i Viken er basert på samme geografiske områder som tidligere undersøkelser. Undersøkelsen er gjennomført ved bruk av webskjema via e-post og ble sendt ut 27. februar og ble lukket 13. mars.
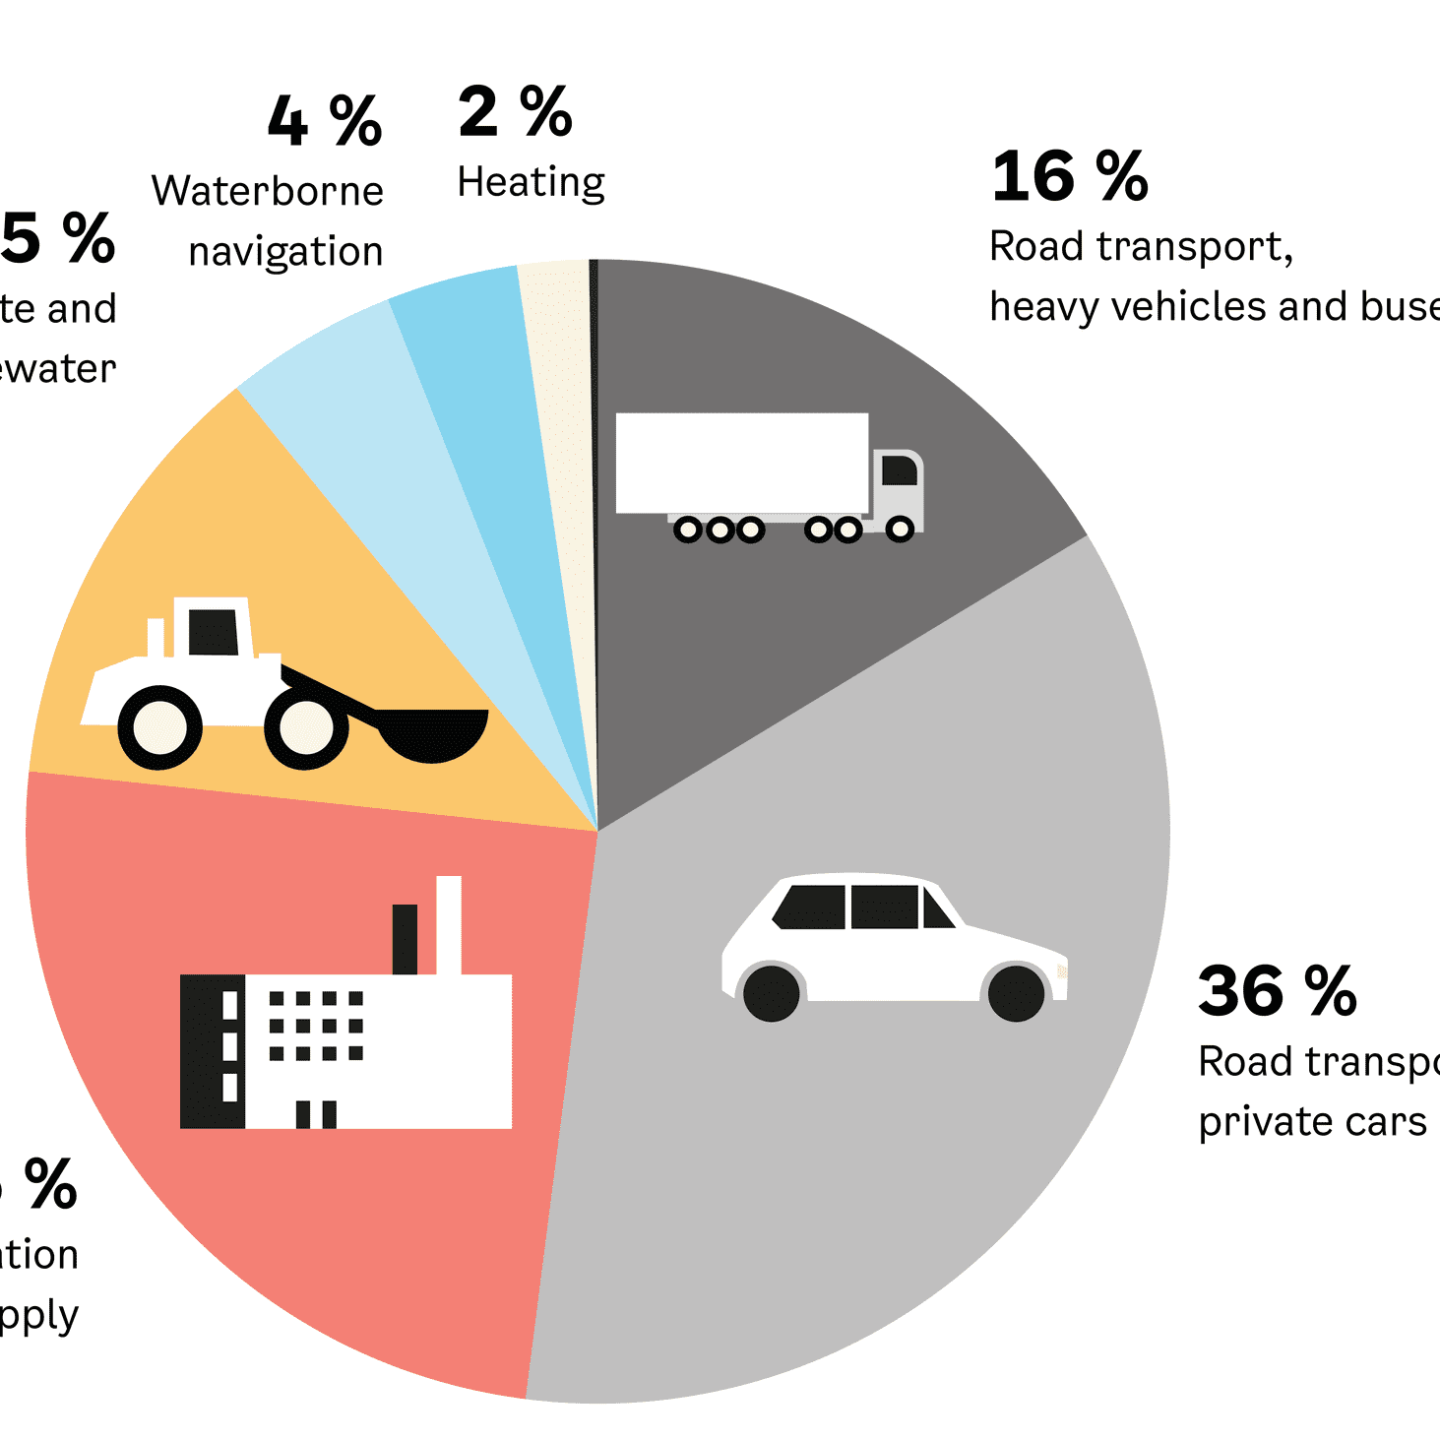
Næringslivsdelen ble gjennomført i tidsrommet 27. februar til 28. mars. Utvalget består av 495 virksomheter innenfor hovedkategoriene service, handel og industri i Oslo med minst 5 ansatte. Bransjen service inkluderer overnattings- og serveringsbedrifter, transport og lagring, mens industri bl.a. omfatter bygg- og anleggsbransjen. Undersøkelsen er gjennomført ved bruk av webskjema via e-post.